
Immersive data experiences using AR and VR let you explore information in engaging, multi-dimensional ways. You can step inside data visualizations, manipulate models in real time, and see spatial relationships clearly. These technologies enhance your understanding by making complex data tangible and interactive. You can navigate virtual environments to uncover patterns or tell compelling stories with data. Keep exploring to discover how these immersive tools can transform your approach to data analysis and communication.
Key Takeaways
- AR and VR create immersive, interactive environments that transform abstract data into tangible, easily understandable visualizations.
- These technologies enable spatial analysis by allowing users to explore data within a 3D context, revealing hidden patterns.
- Immersive experiences facilitate effective storytelling, guiding audiences through data-driven narratives for better comprehension.
- Multi-user AR/VR platforms support collaborative data exploration, fostering teamwork and real-time insights.
- Using AR and VR enhances data communication by making complex information engaging, memorable, and accessible to diverse audiences.

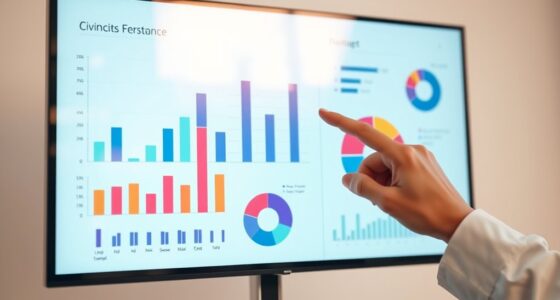
Augmented Reality (AR) and Virtual Reality (VR) are transforming how you visualize data by creating immersive, interactive experiences. These technologies allow you to step inside your data, turning abstract numbers and charts into tangible, engaging visuals. With AR and VR, you’re not just looking at static graphs; you’re exploring data in a three-dimensional space where insights come alive through interactive storytelling. This approach makes complex information more accessible, enabling you to grasp patterns and relationships that might be hidden in traditional charts. By immersing yourself in a virtual environment, you can manipulate data points directly, rotate models, and explore different perspectives in real time, deepening your understanding and retention. Understanding data visualization techniques enhances your ability to interpret and communicate complex datasets effectively.
AR and VR turn data into immersive, interactive experiences, making insights more accessible and engaging.
One of the key strengths of AR and VR in data visualization is their ability to enhance spatial analytics. Instead of viewing data on a flat screen, you can analyze spatial relationships within a three-dimensional context. Imagine analyzing urban planning data by walking through a virtual cityscape, observing traffic flows, or examining environmental changes over time. This spatial awareness helps you uncover insights that are difficult to see in two dimensions. You can identify clusters, outliers, or trends by traversing through the data space, making your analysis more intuitive and exhaustive.
Interactive storytelling becomes a powerful tool when combined with AR and VR. These technologies enable you to craft narratives around your data, guiding viewers through a visual journey that highlights key findings. As you move through the virtual environment, you can emphasize specific data points, add annotations, or demonstrate cause-and-effect relationships dynamically. This storytelling approach makes presentations more compelling and memorable, especially when communicating complex insights to stakeholders who may not be familiar with technical details. It allows you to engage your audience on a deeper level, fostering better understanding and decision-making.
Furthermore, AR and VR facilitate collaborative data exploration. Multiple users can enter the same virtual space, manipulate data together, and discuss insights in real time. This shared experience encourages teamwork and aligns perspectives, especially in scenarios where spatial analytics reveal spatial or physical relationships. Whether you’re working remotely or in a conference room, these immersive experiences break down barriers of distance and abstraction, making data analysis more interactive and inclusive.
In essence, AR and VR are revolutionizing data visualization by transforming passive viewing into active exploration. They turn data analysis into an engaging, spatial adventure where storytelling and analytics intersect. With immersive environments, you’re empowered to see your data from new angles, uncover hidden insights, and communicate findings more effectively—all within a dynamic, interactive setting.
Top picks for "immersive data experienc"
Open Amazon search results for this keyword.
As an affiliate, we earn on qualifying purchases.
Frequently Asked Questions
How Do AR and VR Improve Data Comprehension?
AR and VR improve your data comprehension by making complex information more accessible through interactive storytelling. You actively engage your cognitive processes as you explore data in a three-dimensional space, enhancing understanding and retention. These immersive experiences allow you to manipulate data visually, leading to deeper insights and quicker decision-making. Overall, AR and VR transform passive learning into a dynamic, engaging process that boosts your ability to grasp intricate datasets.
What Hardware Is Necessary for Immersive Data Visualization?
You’ll need a VR headset like Oculus Quest or HTC Vive, or AR glasses such as Microsoft HoloLens, depending on your setup. Hardware requirements include a powerful computer or compatible device with a strong GPU, ample RAM, and precise sensors for tracking. When considering equipment, focus on comfort, compatibility, and resolution to guarantee smooth, immersive data visualization experiences. These equipment considerations help you fully engage with complex data in a 3D environment.
Are There Any Accessibility Concerns With Ar/Vr Data Tools?
Accessibility barriers in AR and VR data tools can limit user participation, especially for those with visual, auditory, or mobility impairments. You might find the user interface challenging if it isn’t designed with accessibility in mind, such as lacking alternative text or easy navigation options. To guarantee inclusivity, developers need to focus on adaptive features, clear controls, and customizable settings that make these immersive experiences usable for everyone.
How Secure Is Data When Used in AR and VR Environments?
Did you know that 90% of data breaches involve some form of human error? When using AR and VR environments, your data’s security depends on strong data encryption and rigorous user authentication. These measures help protect sensitive information from unauthorized access. Always make certain your AR/VR platform has robust security protocols, like encryption in transit and at rest, and multi-factor authentication, so your data stays safe during immersive experiences.
What Are the Cost Implications of Implementing Ar/Vr Data Solutions?
Implementing AR and VR data solutions can be costly, requiring careful budget planning to cover hardware, software, and ongoing maintenance. You’ll face scalability challenges as your needs grow, potentially increasing expenses. To stay within budget, prioritize essential features and consider phased rollouts. While initial costs may be high, investing wisely guarantees your immersive data experiences stay effective and adaptable, helping you manage expenses as your organization expands.
Conclusion
By embracing AR and VR for data visualization, you open the door to immersive insights that were once impossible. These technologies turn complex data into engaging, understandable experiences, empowering you to make smarter decisions. Remember, a picture is worth a thousand words—and with AR and VR, you can bring your data to life like never before. As the saying goes, “Seeing is believing,” so step into this new world and explore the future of data.