
To create ethical data visualizations, you need to recognize and address biases, respecting cultural differences and ensuring transparency. Use inclusive color schemes and consult diverse perspectives to avoid stereotypes or misrepresentation. Be honest about data sources and avoid cherry-picking information to support a particular narrative. Aiming for fairness, clarity, and cultural sensitivity boosts trust and credibility. Continuing will reveal more strategies to effectively navigate these ethical considerations and produce responsible visualizations.
Key Takeaways
- Use diverse data sources and highlight limitations to ensure an honest representation.
- Be aware of cultural meanings behind colors, symbols, and visuals to prevent misinterpretation.
- Engage cultural experts or diverse teams to review visualizations for potential biases.
- Avoid cherry-picking data or using misleading scales that could distort trends or conclusions.
- Maintain transparency about data collection methods and acknowledge potential biases to build trust.

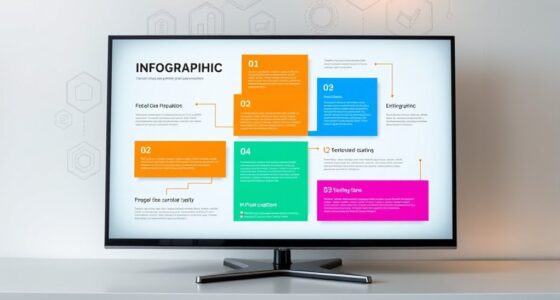
Data visualization plays a critical role in how we interpret information, but with great power comes great responsibility. When you create visual representations of data, you’re influencing how others understand complex ideas, trends, and patterns. That’s why it’s indispensable to approach your work with cultural sensitivity and bias mitigation in mind. If you overlook these aspects, your visualizations can unintentionally reinforce stereotypes, mislead audiences, or exclude important perspectives.
Effective data visualization requires cultural awareness and bias awareness to promote understanding and fairness.
Cultural sensitivity is essential because data often reflects societal norms, values, and biases. You need to be aware of how cultural context impacts the way data is perceived and guarantee your visualizations respect diverse backgrounds. For example, color choices can carry different meanings in different cultures; red might symbolize luck in one country and danger in another. By understanding these nuances, you prevent your visuals from alienating or offending certain groups. This awareness also extends to the data itself—consider whether the data collection process was inclusive and representative of the populations you’re illustrating. If your dataset omits minority voices or marginalized communities, your visualization risks perpetuating exclusion or misinterpretation.
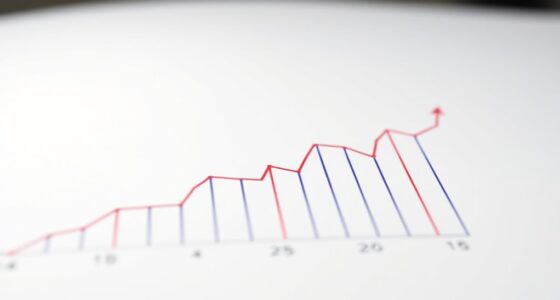
Bias mitigation is another fundamental aspect of ethical data visualization. No dataset is entirely free from bias, and as a creator, you have a responsibility to identify and address potential distortions. Be transparent about your data sources and methods, so your audience understands any limitations. Avoid cherry-picking data points that support a specific narrative; instead, present a balanced view that accurately reflects the underlying information. When designing your visuals, steer clear of misleading scales or omissions that could exaggerate or diminish certain trends. For instance, truncating axes or manipulating proportions can distort perceptions, leading viewers to draw inaccurate conclusions.
Balancing clarity with honesty is key. Your goal is to inform, not manipulate. Always consider how your visualization might be interpreted across different cultural contexts and be proactive in reducing biases. This might mean consulting with cultural experts or diverse team members to review your work. It also involves scrutinizing your own assumptions and questioning whether your visual design unintentionally favors a particular interpretation. By doing so, you create more equitable, accurate, and respectful visualizations that serve the truth rather than personal or organizational agendas. Incorporating vetted data sources ensures your visualizations are based on reliable and credible information, which enhances trust with your audience. Ultimately, practicing cultural sensitivity and bias mitigation elevates your work, fostering trust and integrity in data storytelling.

Data Visualization with Excel, Google Sheets, or Power BI: Turn Raw Data into Stunning Visuals using Everyday Tools with an Ethical AI Lens
As an affiliate, we earn on qualifying purchases.
As an affiliate, we earn on qualifying purchases.
Frequently Asked Questions
How Can I Identify Unconscious Bias in My Visualizations?
You can identify unconscious bias in your visualizations by examining your use of color symbolism and framing techniques. Ask yourself if colors or framing choices subtly influence how viewers interpret data, possibly skewing perceptions. Review your visuals critically, seeking alternative ways to present the data that avoid reinforcing stereotypes or biases. Getting feedback from diverse audiences also helps uncover hidden biases you might overlook, ensuring your visualization remains fair and accurate.
What Are the Best Tools for Ethical Data Visualization?
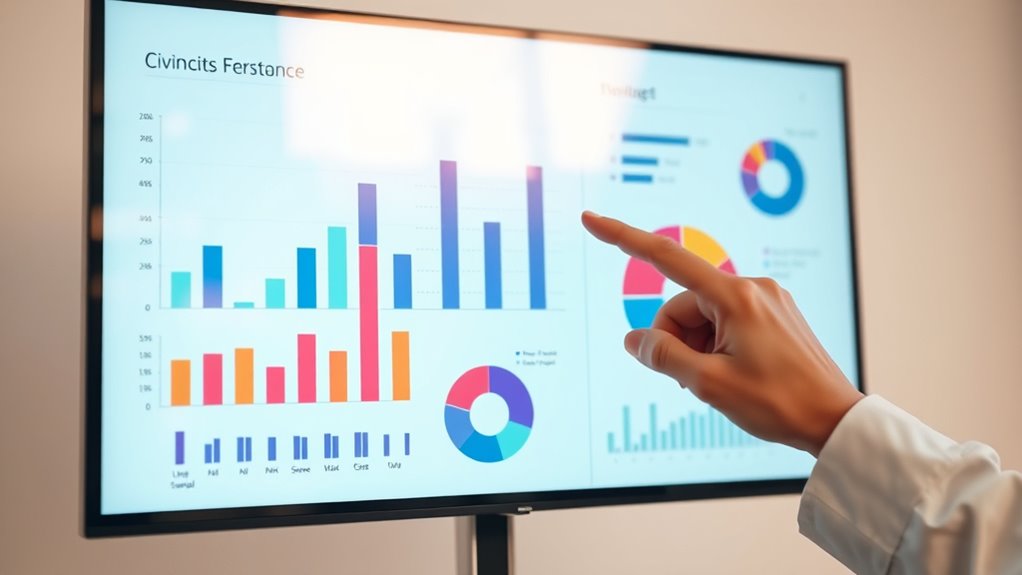
You should use tools like Tableau, Power BI, or Datawrapper to create ethical data visualizations. Focus on selecting neutral color palettes and appropriate chart types, like bar or line charts, that honestly represent your data. These tools help you maintain clarity and avoid misleading your audience. Always double-check your visualizations for bias, ensuring your color choices and chart types accurately reflect the data without distortion or misrepresentation.
How Do Cultural Differences Influence Data Interpretation?
You might be surprised to learn that 70% of misinterpretations stem from cultural nuances. Cultural differences heavily influence how data is interpreted, as various interpretation variations emerge based on background, language, and context. These factors shape perceptions, so you need to take into account diverse cultural perspectives to ensure your visualizations communicate accurately across audiences, avoiding unintended biases or misrepresentations that could skew understanding.
Can Automation Help Ensure Ethical Visualization Practices?
Automation can definitely help guarantee ethical visualization practices by promoting algorithmic transparency and supporting user empowerment. When you implement automated tools, you gain clearer insights into how data is processed, reducing biases and preventing misrepresentation. These systems enable you to identify and correct potential issues early, giving users more control and understanding. Ultimately, automation acts as a safeguard, fostering responsible and ethical data communication.
How Should I Handle Sensitive or Confidential Data Ethically?
You should handle sensitive or confidential data ethically by applying anonymization techniques to protect identities and prevent re-identification. Implement strict data access protocols to control who can view or manipulate the data, ensuring only authorized personnel handle it. Regularly review these protocols and anonymization practices to stay compliant with privacy regulations and maintain trust, always prioritizing confidentiality and ethical standards in your visualization processes.

Magic Palette Color Mixing Guide 11.5 Inch
Please__contact us to solve the problem w/ name: The Color Wheel 5324CW Magic Palette Personal Mixing Guide New…
As an affiliate, we earn on qualifying purchases.
As an affiliate, we earn on qualifying purchases.
Conclusion
By staying vigilant and mindful of biases, you steer clear of misleading visuals that can distort truth. Remember, your data visualization is the lighthouse guiding others through the fog of misinformation. When you prioritize honesty and transparency, you build trust and credibility. Keep ethics at the heart of your work, and your visuals will shine as a beacon of integrity in a sea of data. Stay ethical, and let your charts illuminate truth rather than cast shadows.
![MixPad Free Multitrack Recording Studio and Music Mixing Software [Download]](https://m.media-amazon.com/images/I/71ltIxIuz1L._SL500_.jpg)
MixPad Free Multitrack Recording Studio and Music Mixing Software [Download]
Create a mix using audio, music and voice tracks and recordings.
As an affiliate, we earn on qualifying purchases.
As an affiliate, we earn on qualifying purchases.
cultural sensitivity data visualization
As an affiliate, we earn on qualifying purchases.
As an affiliate, we earn on qualifying purchases.