A smarter way to approach accessible charts is by prioritizing clear contrast, so data stays visible for everyone. Make sure keyboard navigation is seamless, enabling all users to interact effortlessly. Use descriptive labels and alternative text to communicate key info for those with assistive tech. Keep designs simple, well-spaced, and easy to understand. By focusing on these principles, you’ll create more inclusive visualizations. Keep exploring how these strategies can transform your chart accessibility even further.
Key Takeaways
- Use high-contrast color schemes combined with patterns or labels to ensure data visibility for all users.
- Enable full keyboard navigation with logical focus order and visible indicators for seamless interaction.
- Incorporate clear, descriptive labels and alternative text for data points and visual elements.
- Design charts with adequate size, spacing, and minimal clutter to enhance clarity and readability.
- Apply digital accessibility principles to ensure compatibility across devices and future technologies.

Have you ever struggled to interpret complex data visualizations? If so, you’re not alone. Many people find charts and graphs overwhelming, especially when details aren’t clear or accessible. That’s why adopting a smarter approach to creating accessible charts makes a huge difference. The first step is paying attention to color contrast. When colors blend too closely or lack sufficient contrast, it becomes difficult for users with visual impairments or color vision deficiencies to distinguish different data points. Bright, well-contrasted colors help everyone, regardless of their visual abilities, to quickly grasp the information presented. Avoid using color alone to encode data; instead, combine it with patterns or labels so that the information remains accessible even if colors are indistinguishable.
In addition, designing for keyboard navigation is vital. Many users rely on keyboards instead of mice to interact with digital content, including charts and interactive dashboards. Making sure that your charts are fully navigable via keyboard means enabling users to move through data points, legends, and controls with tab keys and arrow keys. This involves implementing logical focus order, clearly visible focus indicators, and accessible controls for zooming, filtering, or highlighting data. When users can navigate your charts seamlessly without a mouse, you create a more inclusive experience that benefits not only those with disabilities but also users in environments where mouse use is limited or inconvenient. Incorporating digital concepts into your design process can further ensure your charts remain accessible across various devices and future technologies. Additionally, understanding how color accuracy influences visual perception can help you choose the most effective color schemes for your charts.
Creating accessible charts isn’t just about compliance; it’s about thoughtful design that respects diverse needs. Use descriptive labels and concise alternative text for data points and visual elements so screen readers can accurately convey the information. This practice ensures users relying on assistive technologies don’t miss out on key insights. Also, consider the size and spacing of data points and labels to avoid clutter, which can be confusing or hard to interpret for users with cognitive disabilities or visual impairments. By combining high color contrast, keyboard navigability, and clear labeling, you craft charts that are both visually appealing and highly functional.
Furthermore, understanding the importance of visual accessibility in your design process can enhance user experience and ensure your charts are adaptable for future technologies and diverse user needs. Ultimately, a smarter approach to accessible charts requires intentional design choices grounded in inclusivity. When you focus on these core principles—color contrast, keyboard navigation, and clear labeling—you make data more understandable, more usable, and more welcoming to everyone. It’s about removing barriers so that all users can engage with your data confidently and efficiently.
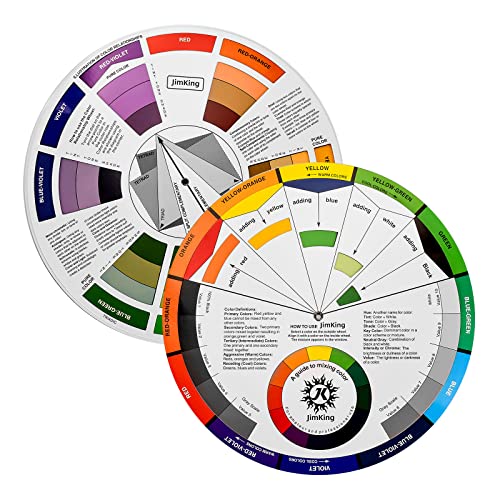
JimKing Creative Color Wheel, Paint Mixing Learning Guide, Art Class Teaching Tool for Makeup Painting Tattoo,Blending Board Chart Color Mixed Guide Hardboard(9.25inch)
Helps organise colours to make choices and combinations easier;Defines common terms and helps the artist to understand colour…
As an affiliate, we earn on qualifying purchases.
As an affiliate, we earn on qualifying purchases.
Frequently Asked Questions
How Can Accessible Charts Improve User Engagement?
Accessible charts boost your user engagement by making data clear and easy to understand. When you use high color contrast, users can quickly interpret information without strain. Ensuring screen reader compatibility allows visually impaired users to access data effortlessly, broadening your audience. You’ll see increased interaction and satisfaction as your charts become more inclusive, making your content accessible to everyone and encouraging more users to explore your data confidently.
What Tools Assist in Creating Accessible Visualizations?
Creating accessible visualizations is like building a bridge for everyone to cross; tools like charting software and accessibility checkers help you do this. You’ll want to focus on color contrast to guarantee clarity and use screen readers to make data understandable for visually impaired users. Tools such as Microsoft Power BI, Tableau, and Adobe Illustrator offer features that help optimize your charts for accessibility, making your data inclusive and engaging for all audiences.
Are Accessible Charts Suitable for All Types of Data?
Accessible charts are suitable for most data types, but you need to prioritize color contrast and font readability to guarantee clarity for all users. When designing, use high-contrast colors and clear fonts so that even those with visual impairments can interpret the data easily. While some complex datasets may require additional explanations or alternative formats, accessible design principles generally improve understanding across all data types.
How Do Accessible Charts Impact Data Interpretation Accuracy?
Think of accessible charts as a clear lighthouse guiding ships through fog. They improve data interpretation accuracy by ensuring color contrast highlights key info and screen reader compatibility makes data understandable for all. Without these features, details can get lost, causing misinterpretation. By prioritizing accessibility, you enhance clarity and reduce errors, ensuring everyone navigates your data landscape confidently and accurately.
What Are Common Pitfalls When Designing Accessible Charts?
When designing accessible charts, you might overlook issues like poor color contrast, making it hard for users with visual impairments to distinguish data. You also risk creating screens that aren’t compatible with screen readers, preventing users from accessing key information. To avoid these pitfalls, make certain of high contrast in colors and test your charts with screen readers frequently. Doing so improves usability and inclusivity for all users.

Keyboard and Reference Chart: Piano/Keyboard Chart for Students and Teachers | Music Theory Poster with Key Signatures Scale Finder and Time Signature Guide | Piano Method Sheet Music Reference Tool
As an affiliate, we earn on qualifying purchases.
As an affiliate, we earn on qualifying purchases.
Conclusion
By adopting this smarter approach, you’ll make your charts as accessible as a well-stocked library in the digital age. Remember, even in the age of chariots and quill pens, clarity and inclusivity mattered—they still do today. So, don’t be the person stuck in a “Stone Age” mindset; embrace accessible charts now. With these tips, you’re not just sharing data—you’re opening doors to everyone, no matter their abilities.

Hands-On Data Visualization: Interactive Storytelling From Spreadsheets to Code
As an affiliate, we earn on qualifying purchases.
As an affiliate, we earn on qualifying purchases.
screen reader compatible chart labels
As an affiliate, we earn on qualifying purchases.
As an affiliate, we earn on qualifying purchases.